Umaku Dashboard
The Umaku Dashboard provides a unified, AI-driven view of project health, progress, and delivery quality.
It combines traditional project metrics with AI agent feedback, giving teams real-time visibility into execution, quality, and risk.
This dashboard helps project managers, engineers, and stakeholders quickly understand:
- How the project is progressing
- The quality of delivered work
- Sprint performance and alignment
- Open risks, bugs, and descoping requests
What You See on the Umaku Dashboard
Section titled “What You See on the Umaku Dashboard”The Umaku Dashboard is divided into multiple sections, each focusing on a specific aspect of project execution.
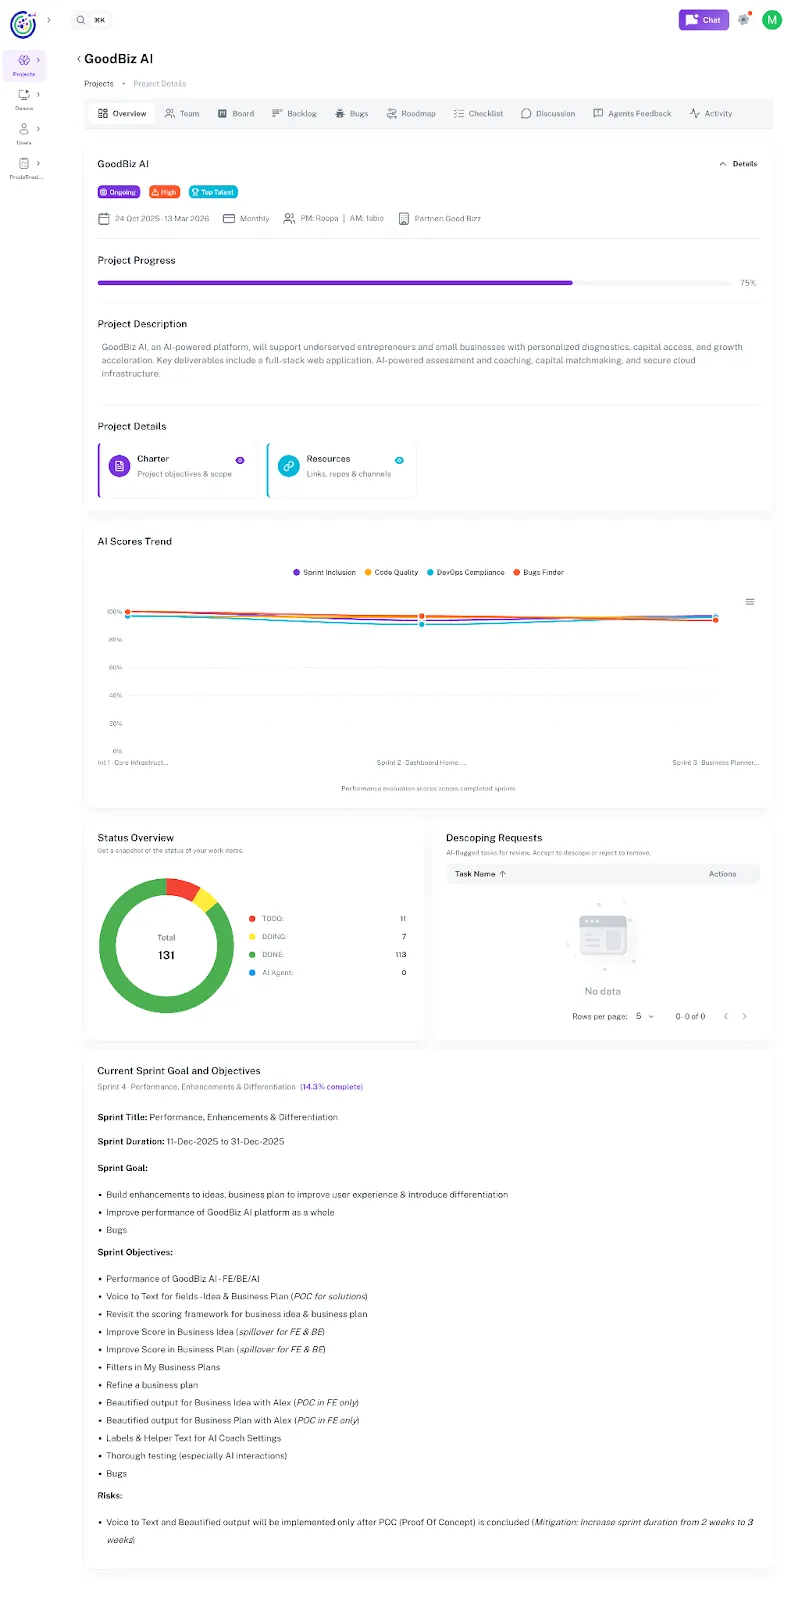
Project Progress
Section titled “Project Progress”The Project Progress bar shows the overall completion percentage of the project.
- Calculated based on completed work items, sprint progress, and milestones
- Gives a quick, high-level indicator of project health
- Helps stakeholders understand how close the project is to delivery
AI Scores Trend
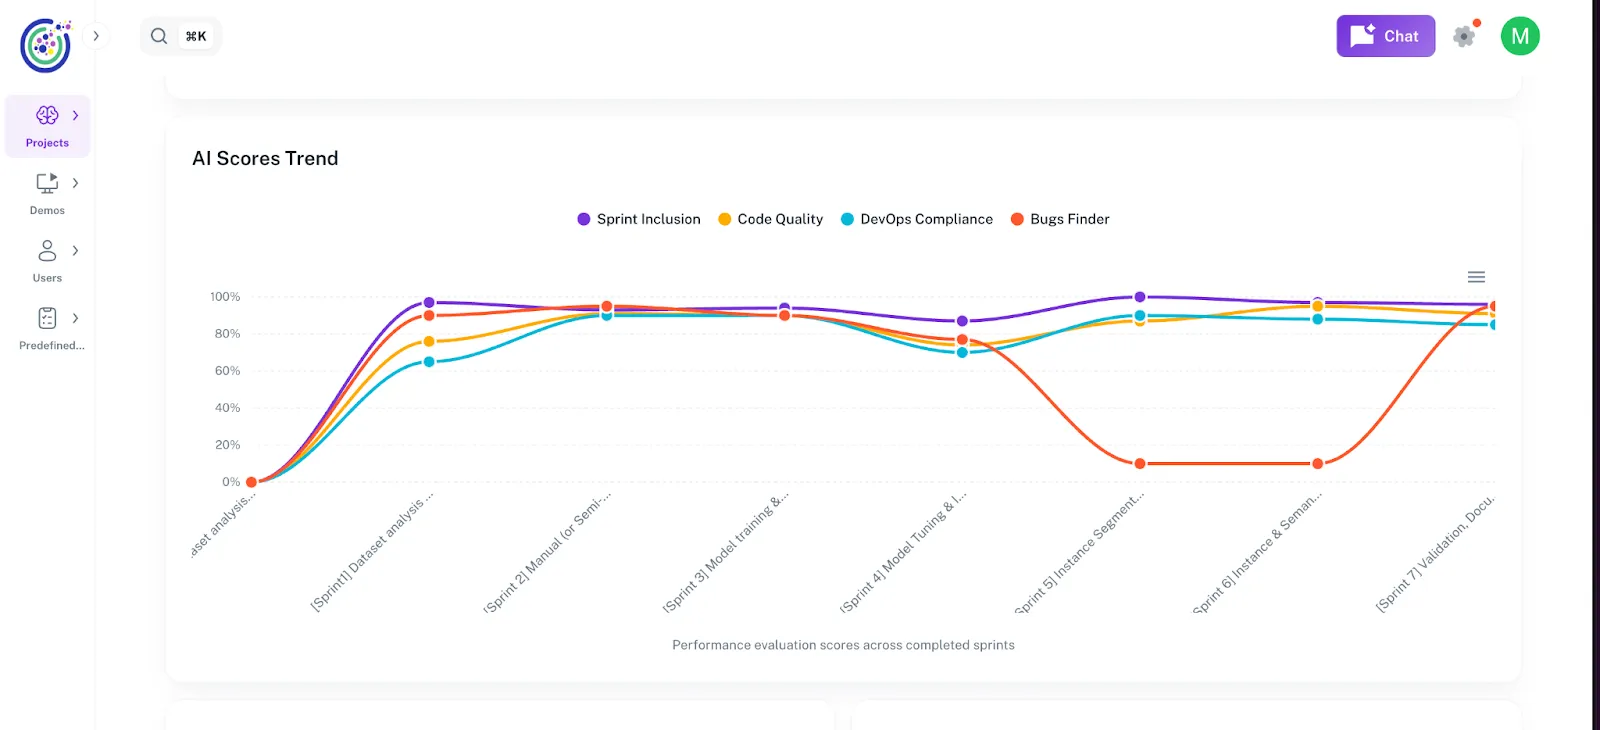
Section titled “AI Scores Trend”The AI Scores Trend visualizes performance insights generated by AI agents across completed sprints.
AI Feedback Dimensions
Section titled “AI Feedback Dimensions”The dashboard tracks four core AI evaluation dimensions:
- Sprint Inclusion
- Measures how well committed sprint items are actually delivered
- Highlights scope stability and planning accuracy
- Code Quality
- Evaluates maintainability, readability, and correctness of submitted code
- Based on AI code analysis and review feedback
- DevOps Compliance
- Assesses adherence to CI/CD practices, deployment standards, and operational readiness
- Identifies gaps in automation or process compliance
- Bugs Finder
- Tracks potential defects detected by AI
- Includes logical issues, edge cases, and regression risks
How to read the chart
Section titled “How to read the chart”- Each line represents a completed sprint
- Scores are normalized as percentages
- Trends help teams identify improvement or degradation over time
Status Overview
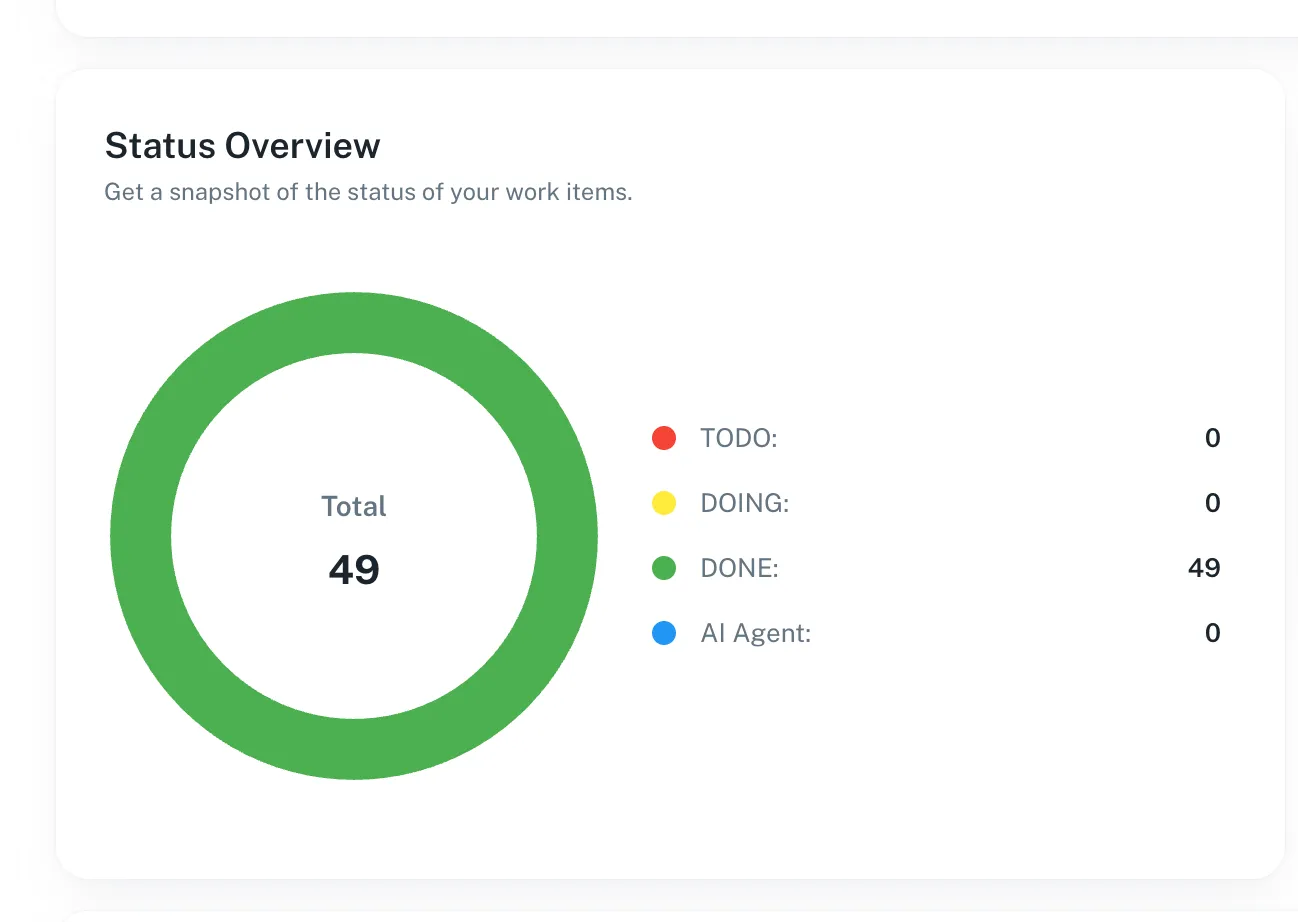
Section titled “Status Overview”The Status Overview provides a snapshot of all work items by status.
Typical statuses include:
- To Do
- Doing
- Done
- Review
- AI Agent (items currently being analyzed by AI)
This section helps teams quickly assess workload distribution and delivery progress.
Descoping Requests
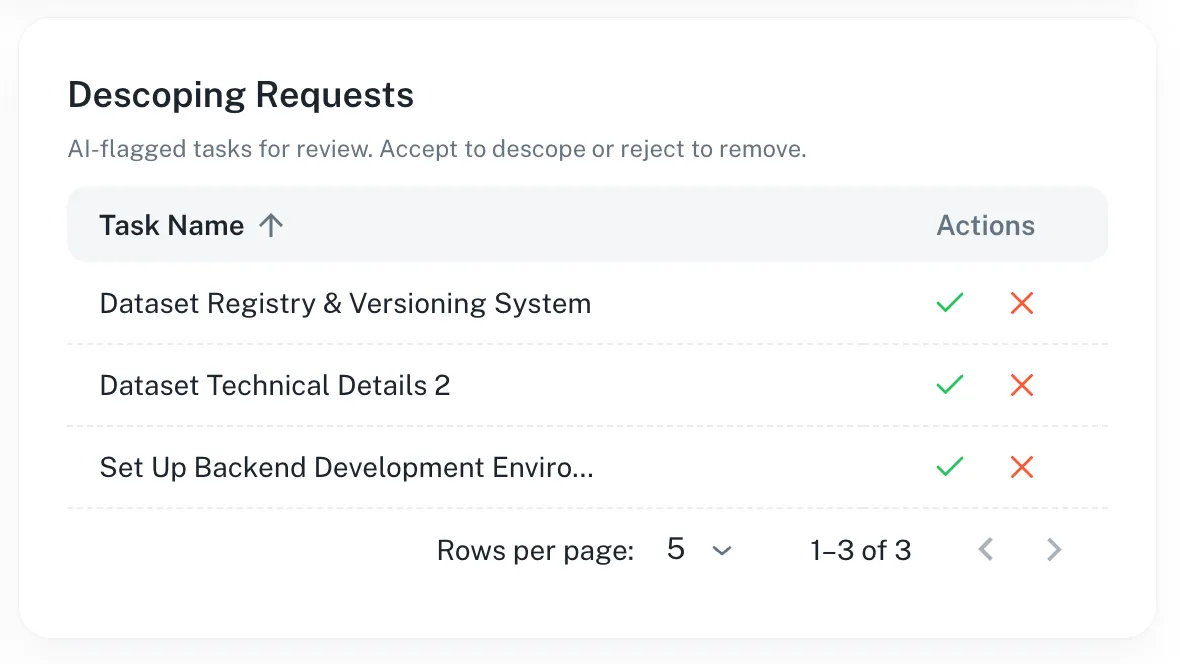
Section titled “Descoping Requests”The Descoping Requests section shows tasks flagged by AI for potential issues.
AI identifies tasks that may have:
- Code quality problems
- Logical errors
- Other issues impacting delivery
Users can review each request and:
- Accept the descope – move the task back to the backlog
- Reject the descope – remove the task from the sprint
This ensures that tasks with potential problems are either reconsidered or removed, helping maintain sprint and project quality.
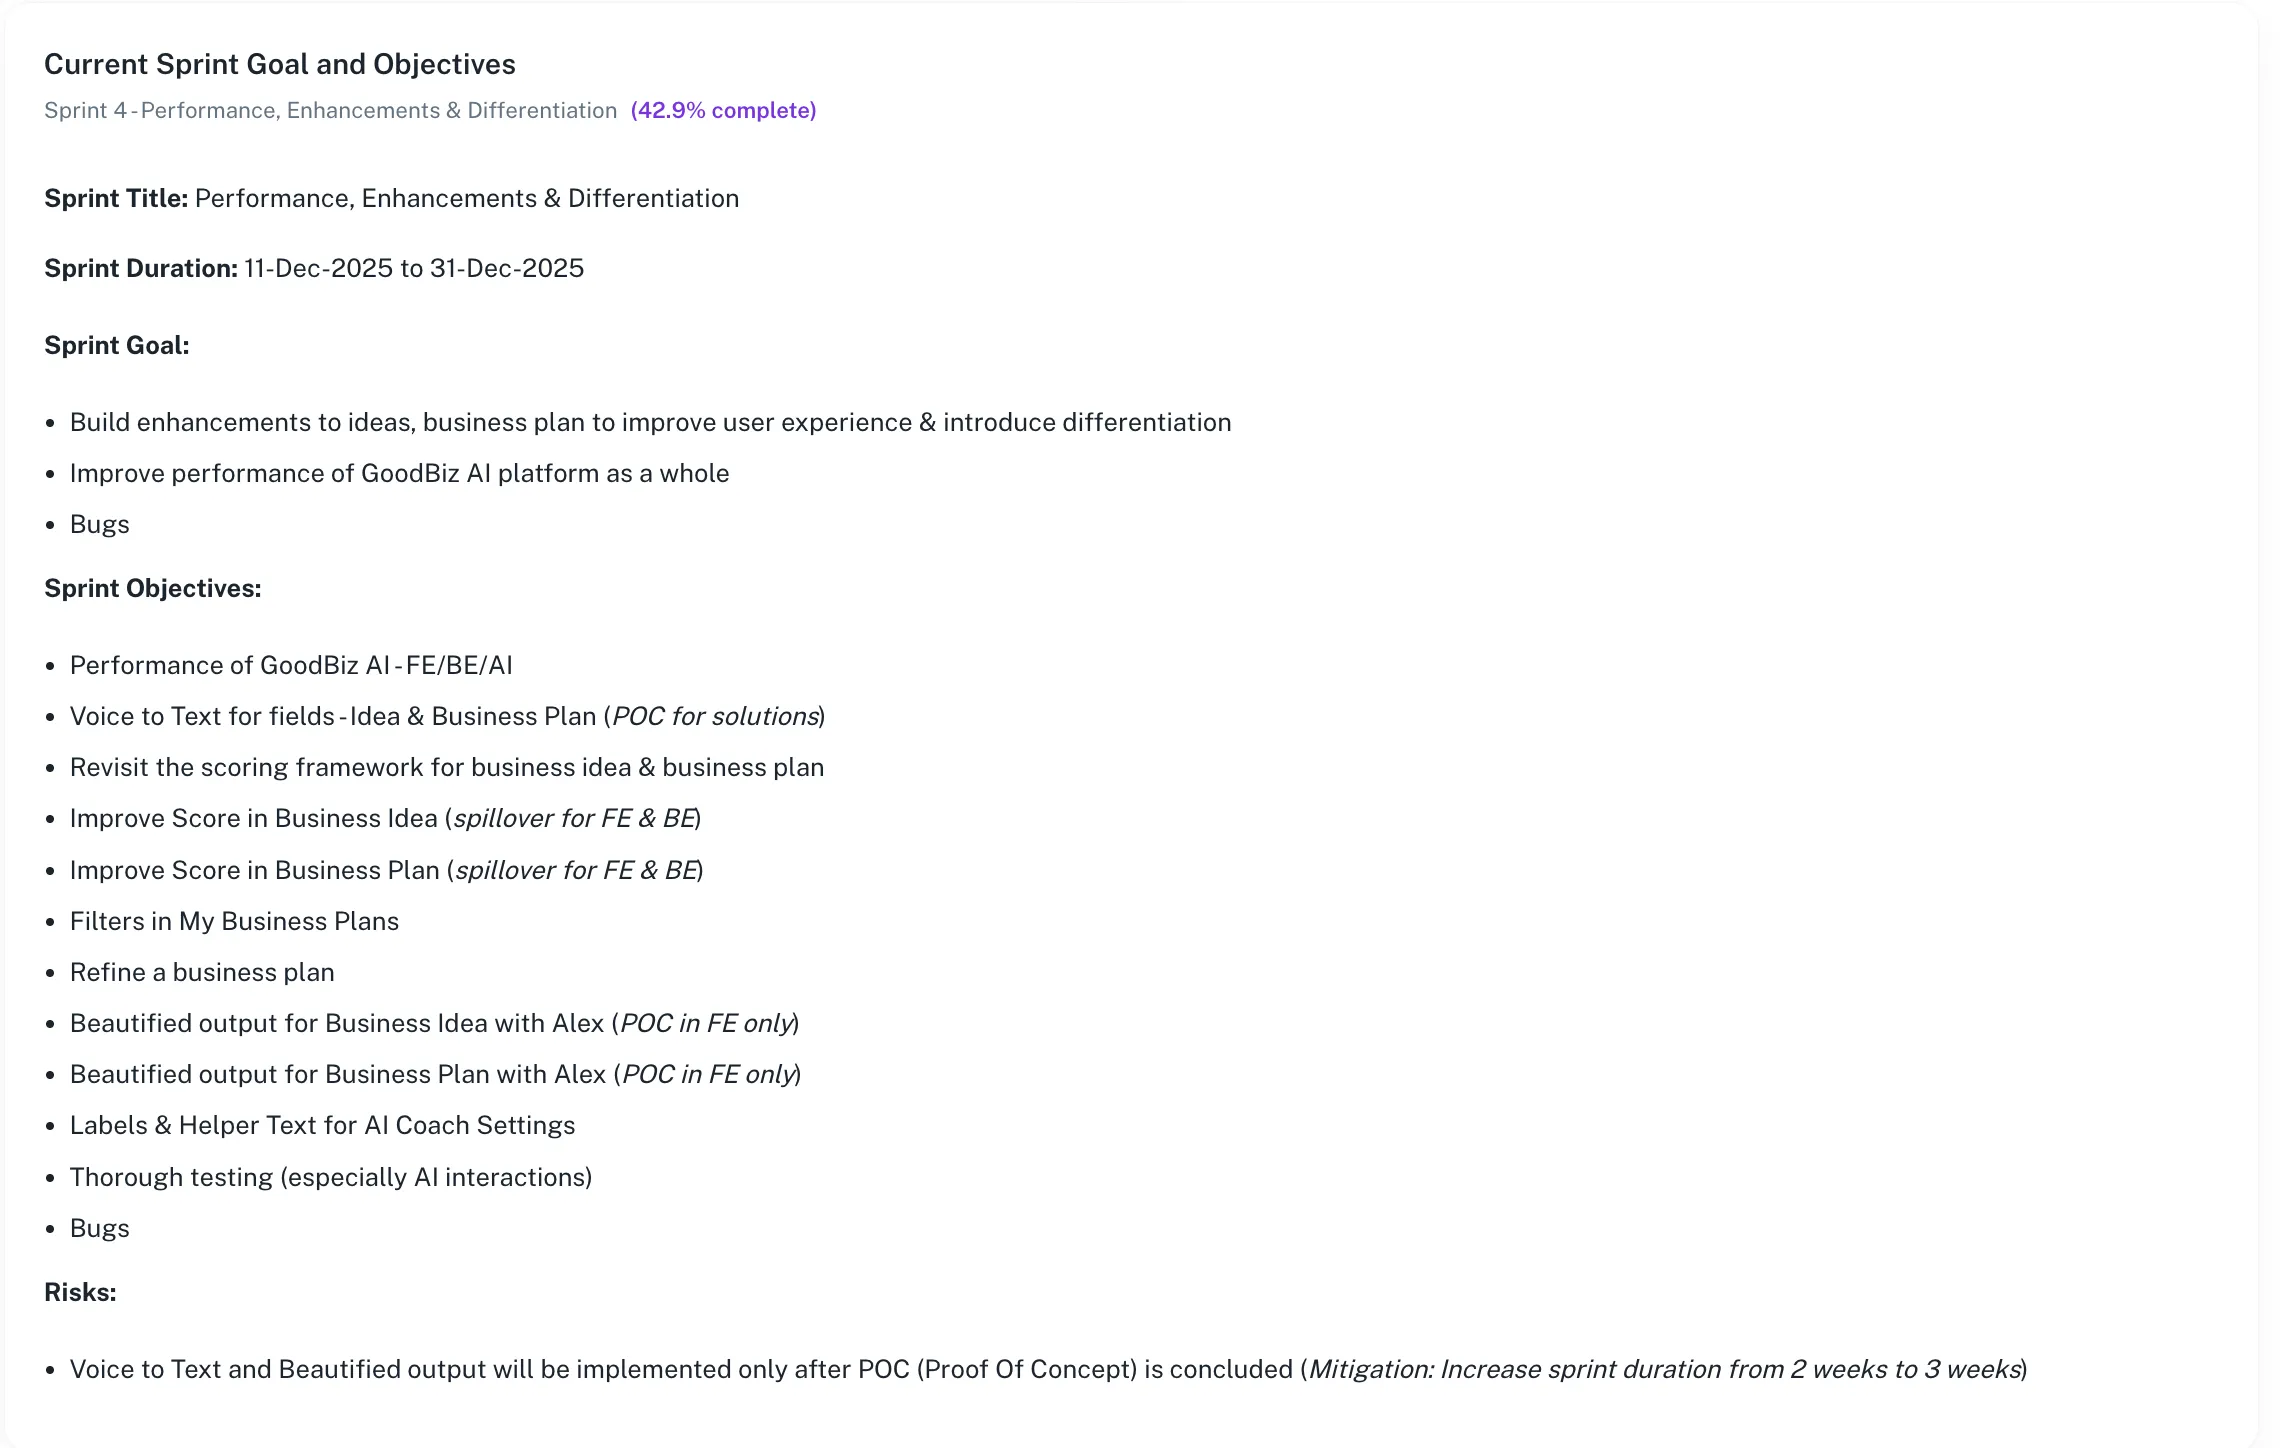
Current Sprint Goal and Objectives
Section titled “Current Sprint Goal and Objectives”This section summarizes the active sprint and its intent.
Includes:
Section titled “Includes:”- Sprint title and duration
- Overall sprint completion percentage
- Sprint goal
- Detailed sprint objectives
Purpose:
Section titled “Purpose:”- Aligns the team around current priorities
- Provides context for AI evaluations
- Helps reviewers understand whether work aligns with sprint goals
The Risks section highlights known risks that may impact delivery.
- Includes AI-identified and manually added risks
- May contain mitigation notes or dependencies
- Helps teams proactively address issues before they escalate
Why the Umaku Dashboard Matters
Section titled “Why the Umaku Dashboard Matters”The Umaku Dashboard combines execution metrics and AI intelligence into a single view, enabling teams to:
- Detect issues earlier
- Improve code and delivery quality
- Maintain sprint alignment
- Reduce scope creep
- Make data-driven decisions faster
Tutorials
Section titled “Tutorials”Use these tutorials to understand and work with the Umaku Dashboard. Each guide walks you through a specific part of the dashboard and explains how to interpret the data shown.
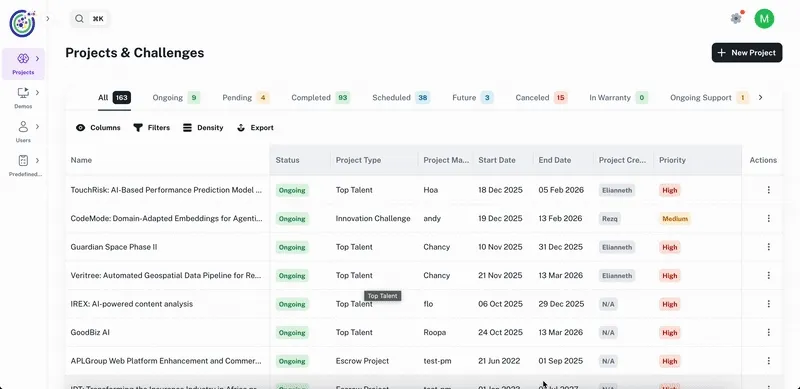
View Project Progress
Section titled “View Project Progress”Learn how to quickly understand the overall progress of a project.
-
Open the Project
Section titled “Open the Project”- Navigate to Projects.
- Select the project you want to view.
- The project opens on the Overview tab, showing the Umaku Dashboard.
-
Locate Project Progress
Section titled “Locate Project Progress”- At the top of the dashboard, find the Project Progress bar.
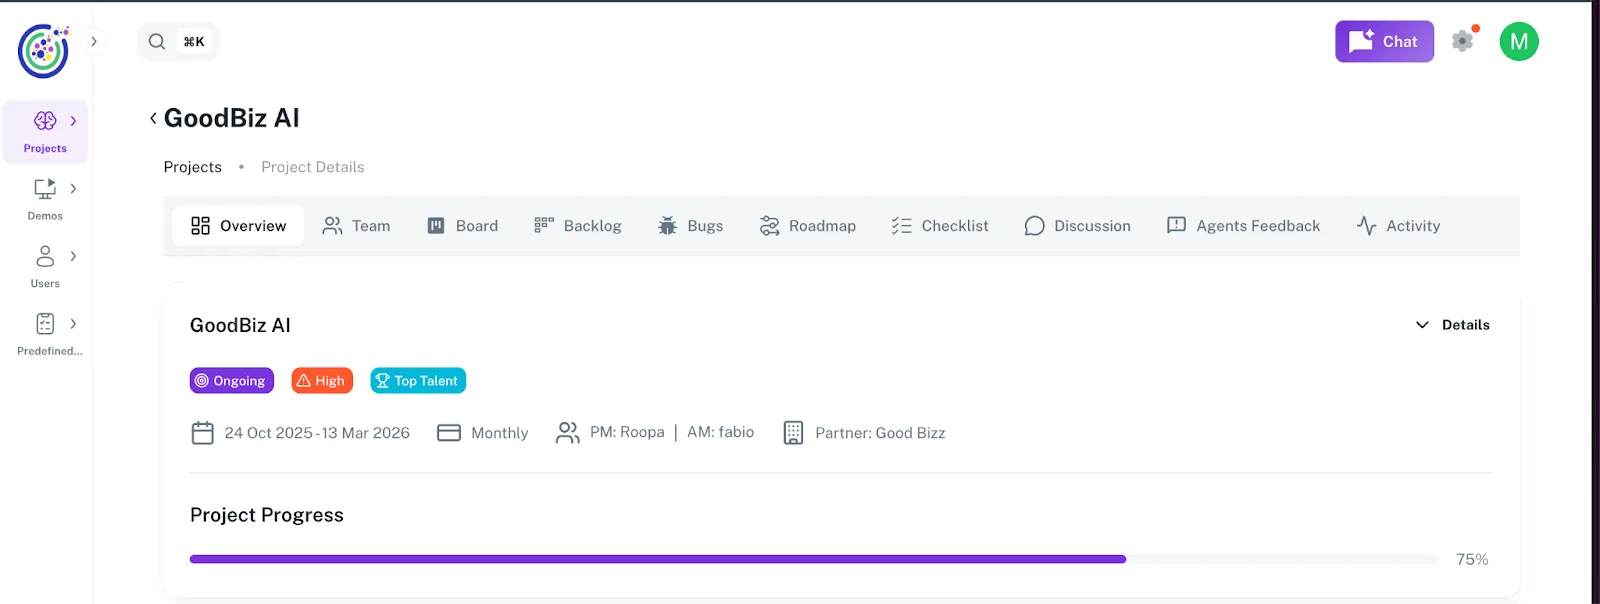 2. Review the percentage shown on the right side.
Understand AI Scores Trend
Section titled “Understand AI Scores Trend”Learn how to read AI-generated performance insights across sprints.
-
Find the AI Scores Trend Chart
Section titled “Find the AI Scores Trend Chart”- Scroll down to the AI Scores Trend section on the dashboard.
- The chart displays AI evaluation scores across completed sprints.
-
Review the Four AI Dimensions
Section titled “Review the Four AI Dimensions”The chart includes four evaluation dimensions:
- Sprint Inclusion – Measures sprint commitment vs. delivery
- Code Quality – Evaluates code maintainability and correctness
- DevOps Compliance – Assesses CI/CD and operational standards
- Bugs Finder – Detects potential defects and regressions
Check Status Overview
Section titled “Check Status Overview”Learn how to view the distribution of work items by status.
-
Locate Status Overview
Section titled “Locate Status Overview”- Scroll to the Status Overview section.
- Review the chart showing all work items grouped by status.
-
Interpret the Data
Section titled “Interpret the Data”- To Do – Items not yet started
- Doing – Items currently in progress
- Done – Completed items
- AI Agent – Items under AI analysis
Review Descoping Requests
Section titled “Review Descoping Requests”Learn how to review tasks flagged by AI for potential removal or deprioritization.
-
Open Descoping Requests
Section titled “Open Descoping Requests”- Scroll to the Descoping Requests section.
- Review the list of AI-flagged tasks.
-
Take Action
Section titled “Take Action”- For each request, review the reason provided by the AI.
- Choose to:
- Accept the descope and moved to the backlog
- Reject it and removed from descoped
Review Current Sprint Goals and Objectives
Section titled “Review Current Sprint Goals and Objectives”Learn how to understand the focus of the active sprint.
-
Locate Current Sprint Section
Section titled “Locate Current Sprint Section”- Scroll to Current Sprint Goal and Objectives.
- Review the sprint title, duration, and completion percentage.
-
Review Sprint Details
Section titled “Review Sprint Details”- Sprint goal
- Sprint objectives
- Key focus areas (features, improvements, bugs)
-
Locate Risks
Section titled “Locate Risks”- Scroll to the Risks section at the bottom of the dashboard.
- Review listed risks and mitigation notes.