Review AI agents feedback
Umaku moves beyond simple “Done” lists by integrating an agentic workflow that actively reviews your project’s health. One hour after the end of every sprint, our AI Agents perform a deep retrospective, analyzing your code, documentation, and project charter to produce four detailed reports.
This guide explains how to access these insights and interpret the feedback to improve your team’s velocity and quality.
1. The Agents Feedback Dashboard
Section titled “1. The Agents Feedback Dashboard”The Agents Feedback tab is your command center for continuous improvement. It provides a high-level synthesis of your project’s performance across all sprints.
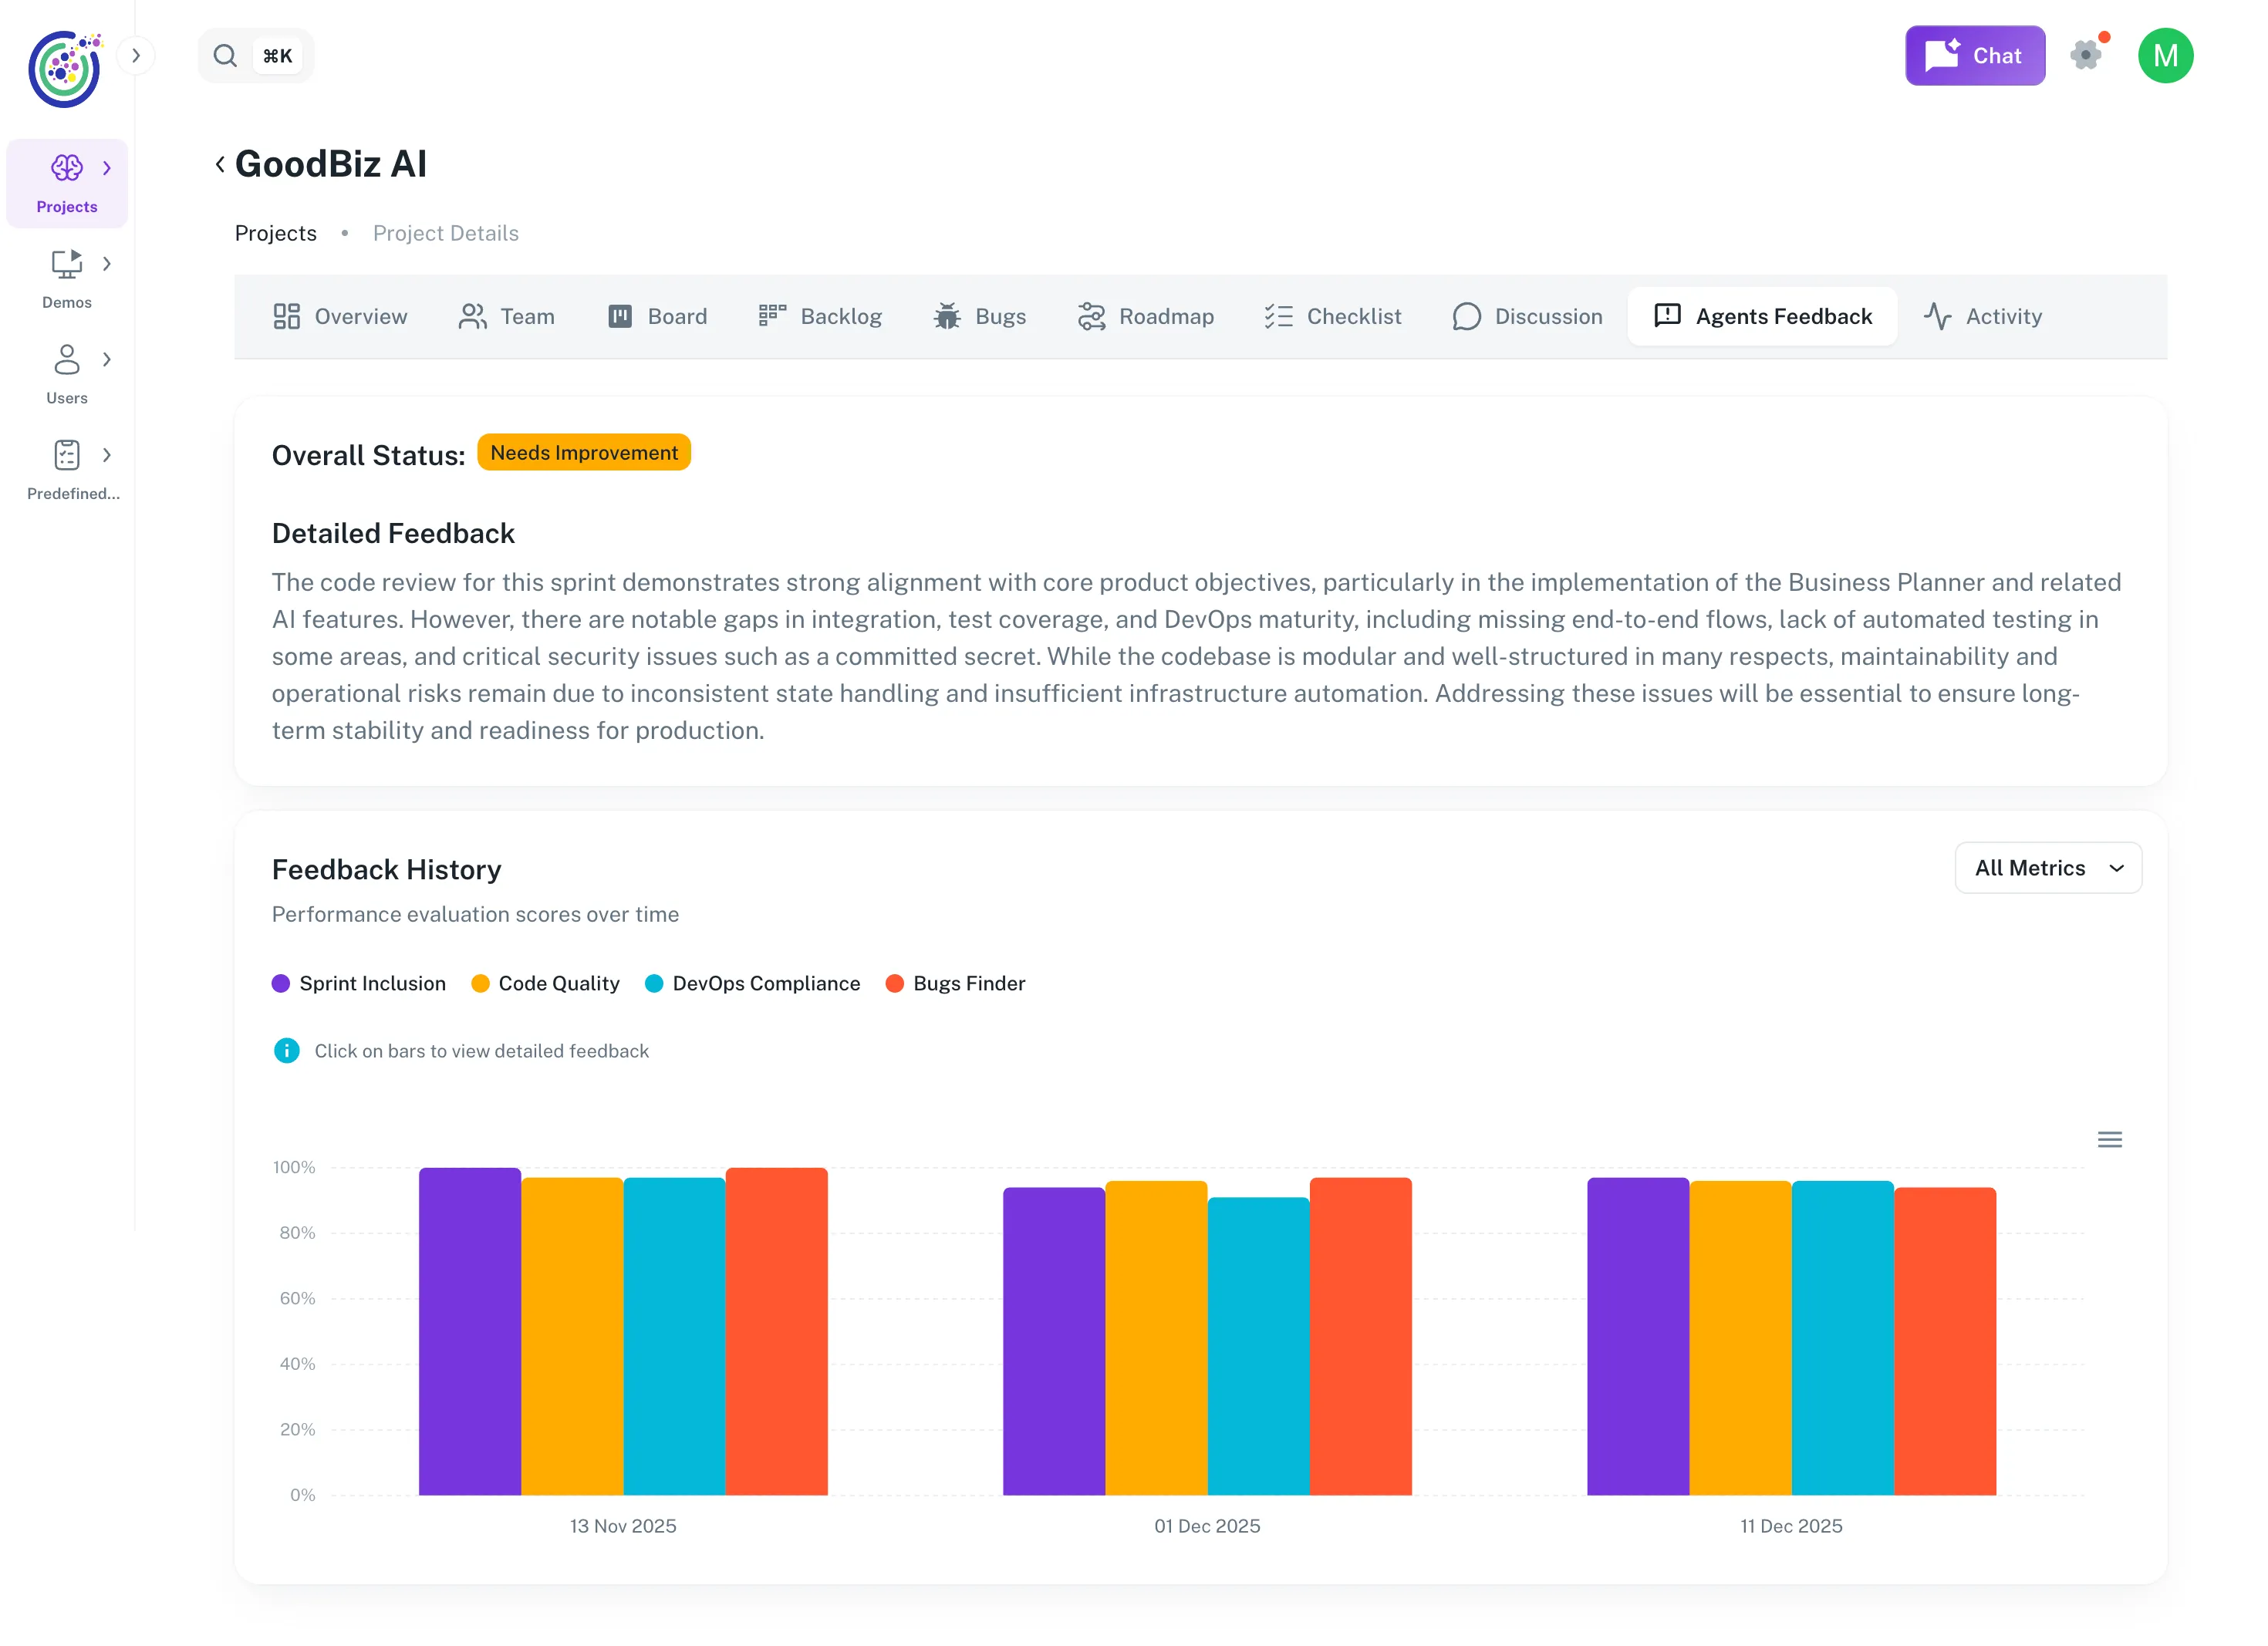
Figure 1: The Agents Feedback dashboard displaying the overall project status, AI-synthesized summary, and historical performance trends.
Key Components:
- Overall Status: A quick health check (e.g., “Needs Improvement”) based on recent sprint performance.
- Detailed Feedback Summary: This is not a static template. An AI agent reads all four technical reports from your sprints and synthesizes them into a single, cohesive paragraph. It highlights critical patterns—such as “excellent functional progress” being undermined by “missing CI/CD pipelines” or “split architectures.”
- Feedback History: A timeline view showing your scores for Sprint Inclusion, Code Quality, DevOps Compliance, and Bugs Finder over time. This allows you to track if your team is improving or regressing in specific areas.
2. Accessing Reports via Roadmap
Section titled “2. Accessing Reports via Roadmap”While the Dashboard gives you trends, the Roadmap is where you access the specific data for each sprint.
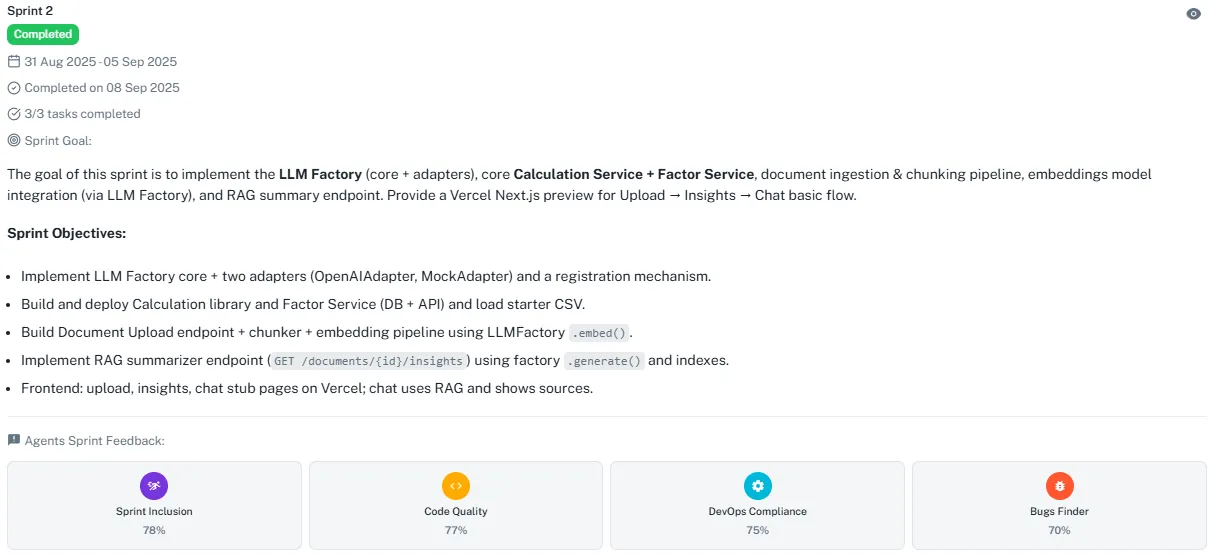
Figure 2: Completed sprints in the Roadmap display four colored icons representing the generated reports.
How it works:
- Navigate to the Roadmap tab.
- Scroll to any Completed Sprint.
- You will see the Agents Sprint Feedback section containing four report cards:
- Sprint Inclusion (Purple)
- Code Quality (Yellow)
- DevOps Compliance (Cyan)
- Bugs Finder (Red)
- Clicking any card opens the detailed PDF report directly in the Umaku viewer (see in tutorial).
3. The 4 Pillars of Analysis
Section titled “3. The 4 Pillars of Analysis”Umaku Agents don’t just look for syntax errors; they understand the intent of your project. Here is what each report covers:
🟣 Sprint Inclusion Agent
Section titled “🟣 Sprint Inclusion Agent”- Goal: Ensures the work delivered matches the promise made in the Project Charter and Sprint Plan.
- What it checks: It verifies if the tasks align with the “SMART goals” of the charter and flags “Out-of-Scope” elements. For example, it confirms if “backend automation” tasks were actually completed versus just “frontend rendering.”
- Key Metric: Alignment Score (%).
🟡 Code Quality Agent
Section titled “🟡 Code Quality Agent”- Goal: Evaluates the maintainability and Pythonic nature of your code.
- What it checks: It reviews style (PEP8), logical nesting, and modularity. It even provides “Before vs. After” code snippets—showing you exactly how to refactor a class name to PascalCase or how to group imports correctly.
- Key Metric: Maintainability Compliance Score (%).
🔵 DevOps Compliance Agent
Section titled “🔵 DevOps Compliance Agent”- Goal: Verifies deployment readiness and infrastructure security.
- What it checks: It looks for critical files like .env.example, Dockerfile, and CI/CD configurations (.github/workflows). If a Dockerfile is referenced in the README but missing from the repo, this agent will flag it as a “Major Blocker.”
- Key Metric: DevOps Maturity Score (%).
🔴 Bugs Finder Agent
Section titled “🔴 Bugs Finder Agent”- Goal: Detects logical flaws that might pass a compiler but fail in production.
- What it checks: It identifies issues like “Silent Failures” (validating data but not logging errors), missing health check endpoints, or scripts that abort batch processing on the first error instead of skipping to the next item.
- Key Metric: Logical Bug Score (%).
Tutorial
Section titled “Tutorial”Analyzing & Actioning AI Feedback
Section titled “Analyzing & Actioning AI Feedback”Once the Umaku Agents have completed their sprint retrospective, it is time to dive into the data. This tutorial guides you through opening a report, interpreting the code comparisons, and understanding the scoring system.
-
Open a Report
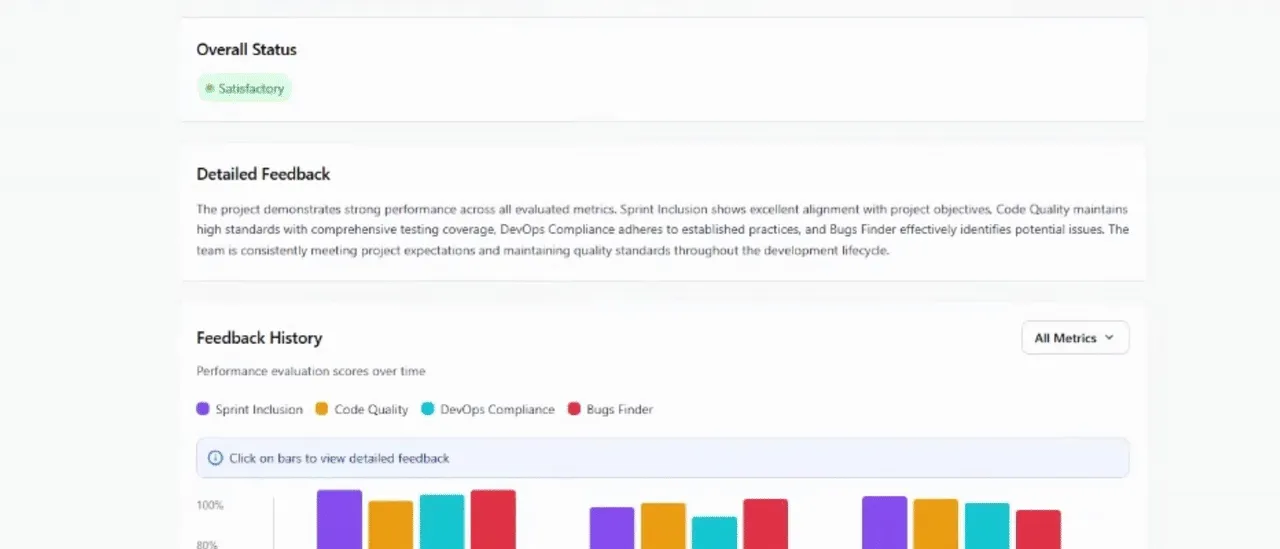
Section titled “Open a Report”You can access the detailed PDF reports from two locations:
- The Dashboard: Click directly on any colored bar in the Feedback History chart.
- The Roadmap: Click on the specific Agent icon (e.g., the yellow Code Quality icon) on the completed sprint card.
-
Navigate the Report Viewer
Section titled “Navigate the Report Viewer”Clicking an icon opens the Umaku PDF Viewer directly in your browser. You do not need to download the file to read it.
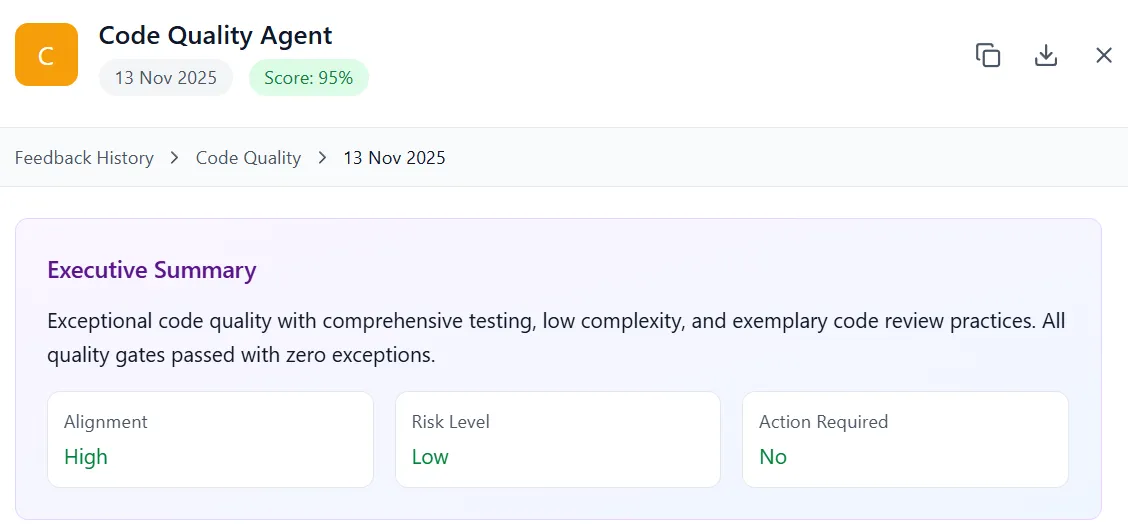
Figure 3: The integrated viewer displaying the “Code Quality” report. Note the “Executive Summary” and side-by-side “Code Snippet Comparisons”.
The Interface Includes:
- Executive Summary: A high-level overview of the sprint’s health.
- Scrollable Content: The full report is rendered vertically.
- Export to PDF: A button in the top-right header allows you to download the file for offline sharing or archiving.
-
Analyze Code Snippet Comparisons
Section titled “Analyze Code Snippet Comparisons”The Code Quality report is particularly powerful because it doesn’t just tell you what is wrong; it shows you how to fix it.
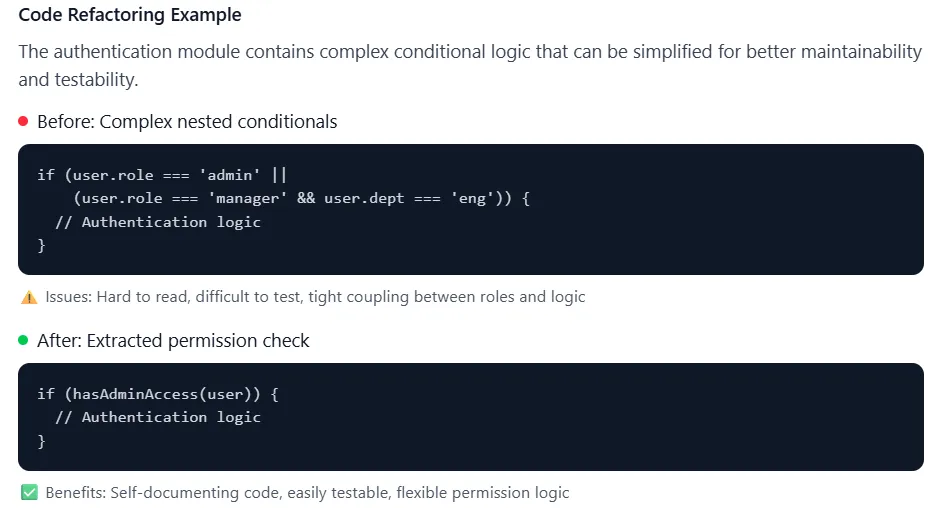
Figure 4: The viewer displays “Original Code” (top) and “Improved Code” (bottom) to highlight specific refactoring opportunities.
How to Read This:
- Original Code: The agent pulls the exact block of code from your commit that triggered the flag.
- Example: A class named class raster_validator: (Snake Case).
- Improved Code: The agent rewrites the code following Python best practices.
- Example: Refactoring it to class RasterValidator: (PascalCase) with added type hints like raster_path: str.
- Improvement Note: A concise explanation of why the change matters (e.g., “Class name follows PascalCase per PEP8”).
-
Interpret the Scoring & Deductions
Section titled “Interpret the Scoring & Deductions”Umaku provides a quantifiable “Maturity Score” for every sprint. Understanding how this is calculated helps you prioritize fixes.
Scoring Logic:
- Starting Score: Every sprint begins at 100%.
- Major Deductions (-4%): Critical blockers.
- Example: Missing Dockerfile or no CI/CD config (.github/workflows). These prevent deployment and are weighted heavily.
- Minor Deductions (-1%): Friction points or documentation gaps.
- Example: referencing a .env.example file that doesn’t actually exist in the repo.
-
Exporting & Next Steps
Section titled “Exporting & Next Steps”Once you have reviewed the findings, you can download the report to attach it to a new “Refactoring” ticket or share it with stakeholders.
- Click the Export to PDF button in the top right corner of the viewer.
- The file will download to your local machine.